Better performance management for better project outcomes
What is earned value?
Earned Value Management (EVM) can be a dry subject for some, however, the practicality and the benefits it can provide for organisations make it worthy of consideration. EVM is a project controls process which, some say, comprises best practice to objectively measure and manage a project’s scope, plan, and cost performance in a structured way.1
Authors: Fernando Barragan Rajo and Balint Laszlo, Senior Consultants, Madrid and Munich, Driver Trett Mainland Europe
The basis of the method is to set up a performance measurement baseline (PMB - the baseline programme or schedule) which must include the defined scope breakdown and associated assumptions, the activities scheduled with the correct logical sequence and the resources or costs/time associated with the schedule. Then, one needs to keep track of the status of the planned work, physical percentages achieved of the different tasks, and the actual spend to date of the project’s budget.
What is it used for?
As EVM integrates planning, cost control and the definition of the project scope into a single tool,2 it is used to forecast the final cost and project duration, and hence can act as an early warning system to provide opportunities to prevent and/or mitigate or overcome delays and cost overruns. Another positive aspect of EVM is that the data should provide points against which to objectively measure the project status (in time and cost). EVM reporting, when done correctly and accurately, enables the user to see what has been achieved of the planned work and what the cost of it was. Also, it should show if this cost is greater or lower than the planned budget (Cost Performance Index – ‘CPI’) and if the project is ahead or behind the planned schedule (Schedule Performance Index – ‘SPI’).
Definition of main parameters
It may sound complicated, but the main parameters or data points/metrics required for the analysis are low in number and can be counted on the fingers of one hand. This measurement system uses the scheduled amount of work (Planned Value) with the achieved amount of work (Earned Value) at a point in time,3 then measures the Earned Value against the cost (Actual Cost) of achieving that work. With these three data points one can calculate the true performance of the project and a trend analysis can be drawn of where the project might be heading to...
In simple terms:
- Planned Value (PV) also called Budgeted Cost of Work Scheduled (BCWS) is the initial plan for the work to be completed, otherwise known as the budget.
- Earned Value (EV) also known as Budgeted Cost of Work Performed (BCWP) is the proportion of the budget that has actually been done, i.e., what is physically complete (% of the Plan).
- Actual Cost (AC) also known as Actual Cost of Work Performed (ACWP) is the true cost of the work completed to date, in financial terms the sum of all the costs actually accrued for a project to date.
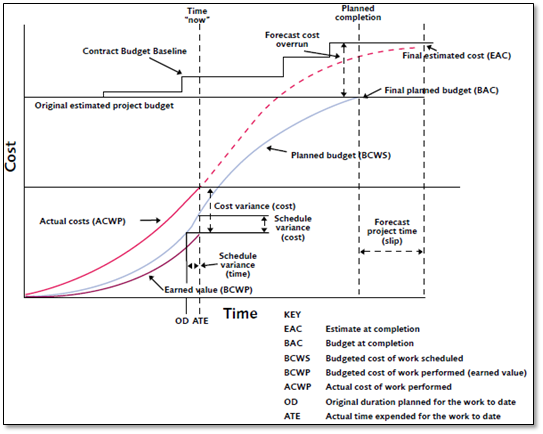
Figure 1., EV Graph including Trend Analysis. Source: Association for Project Management 2013 //EV Management: APM Guidelines (2008)

Figure 1. EV Graph including Trend Analysis For true project control enthusiasts and subsequently for a project’s management, the forecasting indicators (Figure 2) can be even more valuable as they show that if no corrective or mitigating actions are taken, the project may be late with an associated cost overrun. Figure 1 shows the correlation between the three metrics in terms of variances and indices. The first and foremost important one is Schedule Variance (SV) = EV – PV and it represents how much the project is ahead (when SV>0) or behind (when SV<0) the scheduled time of completion. In the graph it can be seen that the schedule variance can be measured in both time and cost.
Cost Variance (CV) = EV – AC indicates how much is the project is under (CV>0) or over (CV<0) its originally budgeted value. It must be mentioned that these cost variations are subjected to errors due to the correct set up of cost control systems.4
Two other main calculations provide a further outlook of the project’s performance. Schedule Performance Index (SPI) = EV/PV, and Cost Performance Index (CPI) = EV/AC, where SPI represents production productivity in relative terms and CPI informs how efficiently resources are being used. If it should be seen that either are below 1, then the project is experiencing difficulties i.e., is behind schedule or over budget, respectively.
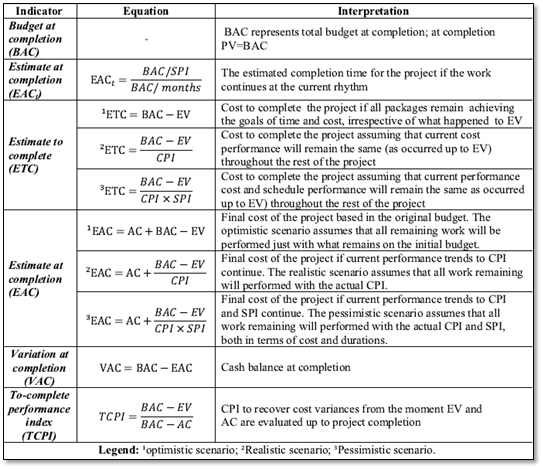
For true project control enthusiasts and subsequently for a project’s management, the forecasting indicators (Figure 2) can be even more valuable as they show that if no corrective or mitigating actions are taken, the project may be late with an associated cost overrun.
Figure 2., EV Forecasting Indicators. Source: (Candido Heineck & Neto 2014).

Benefits of use and value added
With the use of EVM to measure project performance, management can have more certainty of a project’s position in terms of what work has been achieved against the baseline and also what it has cost to achieve that amount of work. The value for money equation (CPI) gives a good indication of whether the work done has been achieved efficiently. Earned Value Management provides data that can inform time and cost recovery action plans to avoid or mitigate major cost and time overruns. If the Change Control System behind EVM is set up correctly it can help manage the risks associated with scope creep throughout the project. If EVM is applied across an organisation’s portfolio of projects, it can assist with good governance of how progress and performance of that portfolio is managed. With the cost management capabilities of EVM, cash-flow can be measured correctly and optimised if appropriate corrective actions are taken. EVM is also one of the industry recommended methodologies for measuring loss of productivity, and one of the most common approaches followed when determining loss of productivity compensation via construction claims, as we shall develop further in our regional analysis. The following is an example of where EVM has been very effectively used.
London 2012 Olympics is one of the great examples of EVM usage to complete the venues on time and to the set budget by the U.K. government and the Olympic Committee. At the Olympics it can be seen that the system requirement to integrate several systems like Primavera P6 planning tool with the cost system through COBRA was fundamental to the setup. The EVM system benefited the 2012 Olympics with disciplined approach to measuring performance against a plan, it was a powerful tool for establishing Trends and giving Early Warnings. It acted as an enabler for Risk identification & implementation of successful mitigation action plans, also facilitated effective forecasting.5 A similar approach has been used at the London Power Tunnels project where the rewire of the capital electricity system used the same EVM approach to manage and control the project performance.
Earned value as a recommended tool to measure loss of productivity in claim preparation and in dispute resolution proceedings
Loss of productivity is often one of the major causes of additional costs incurred in a project. EVM is one of the most common methods used to calculate loss of productivity where a claim is made for the same.
Loss of productivity occurs if a contracting entity does not reach its expected or achievable production rate. It can be described for example as that entity producing less than its anticipated output per hour of work. In such instances, the entity is spending more effort per unit of production than initially anticipated.
Two of the most internationally recognised advisory bodies in the fields of construction and engineering dispute resolution and project controls are the Society of Construction Law (SCL) and the Association of American Cost Engineers (AACE).
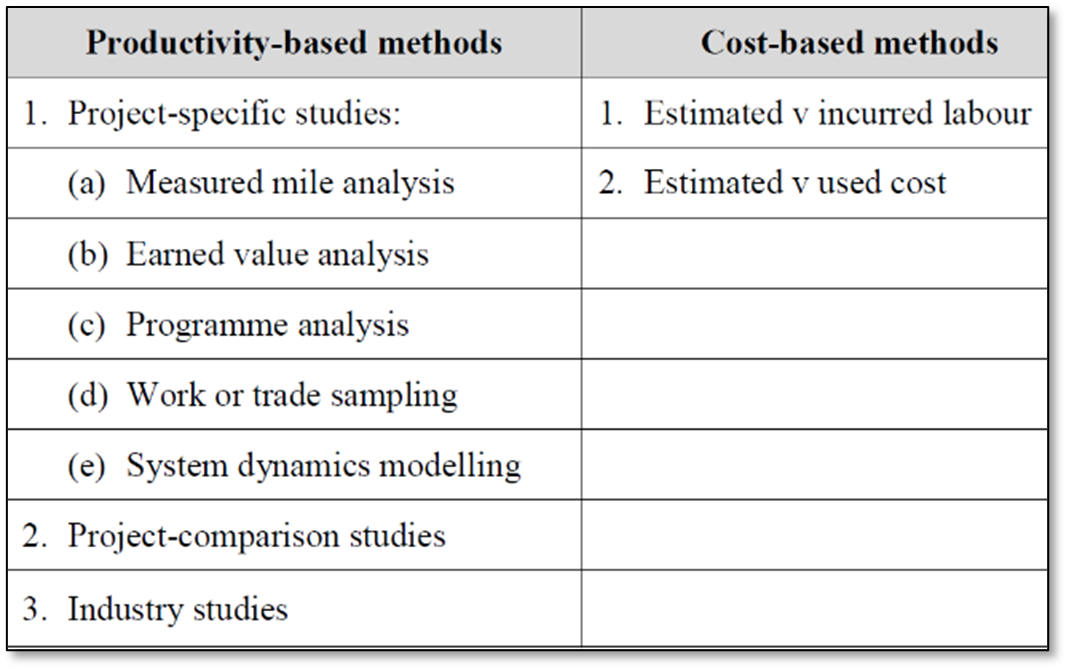
The SCL´s “Delay and Disruption Protocol 2nd Edition 20176 ” under its chapter “Methods of Disruption Analysis” and the AACE´s “Recommended Practice 25R-03 – Estimating lost labour productivity in construction claims7“ consider certain methodologies to be used to measure/analyse disruption. Both bodies give preference to the use of Project Specific methodologies in order to assess disruption. The SCL set out the following methodologies which it considers appropriate.
Figure 3., SCL Methods of Disruption Analysis. Source: SCL Delay and Disruption Protocol 2nd Edition.

Within the project specific studies, the most widely accepted method of calculating lost productivity according to the SCL is the Measured Mile Analysis. Earned Value is also one of the most reliable methodologies as can be observed in the figure below.
- Measured Mile compares productivity for two similar tasks when one of them is affected by disruption and the other is not. This is not always an option in cases where there is not a section on the works with similar circumstances to the section that is being analysed that has not been disrupted.
- Earned Value compares productivity of the task affected by disruption against the planned productivity for that task.
Overall, it can be said that, Earned Value is a methodology which provides high reliability and requires a moderate amount of contemporaneous records, which makes it a good option when preparing and quantifying loss of productivity claims.
When performing an Earned Value analysis, the first thing necessary is to prove that the planned productivity or contract productivity is realistic. In order to prove that one ought to substantiate the productivity used based on construction cost databases, machine specifications or other recognised studies in the field.
By comparing both productivities (actual or current vs contractual or planned) one would be able to evaluate the loss of productivity. If the project is divided into windows and sections where disruption is clearly identified, it is possible to get a measure of that disruption by applying EVM.
Which region uses it the most?
EVM is commonly used in the United States, the UK and in countries where the UK historically has had influence and involvement such as parts of the Middle East and Asia Pacific. EVM is typically used in medium range and large projects and where there is budget for dedicated project controls resources.
Summary
To be effective, EVM ought to be set up as early as possible upon commencement of a project, where the Cost Breakdown Structure (CBS) and the Work Breakdown Structure (WBS) may not yet be defined, in order that they can be defined in parallel. A correct fit between the CBS and the WBS is a crucial factor in successful EVM implementation.
On a world where the project requirements are rapidly growing and where the uncertainty can easily turn the results of a project from benefits into losses, a correct EVM implementation is a key objective to understand the cost and time position of a project at any given moment, and thus, implement the necessary measures to mitigate risks and ensure its success.
“Action is the foundational key to all success” – Pablo Picasso
This article was written for issue 26 of the Driver Trett Digest. To view the publication, please visit: www.driver-group.com/digest-issue-26
1. Association for Project Management. (2013). Earned Value Management Handbook. Princess Risborough: APM Princess Risborough.
2. Candido, L. F., Heineck, L. F., & Neto, J. d. (2014). Critical Analysis on Earned Value Management (EVM) technique in building construction. Oslo, Norway: Proceedings IGLC-22.
3. Association for Project Management, (2015). Planning, Scheduling, Monitoring and Control. The Practical Project Management of Time, Cost and Risk. Princes Risborough: APM.
4. Candido, L. F., Heineck, L. F., & Neto, J. d. (2014). Critical Analysis on Earned Value Management (EVM) technique in building construction. Oslo, Norway: Proceedings IGLC-22.
5. Marshall, A. (2019). Olympic Delivery Authority* Earned Value in the London 2012 Programme. Retrieved from SlidePlayer: https://slideplayer.com/slide/15019922/
6. SCL´s “Delay and Disruption Protocol 2nd Edition 2017” – Methods of Disruption Analysis
7. AACE´s “Recommended Practice 25R-03” – Estimating lost labour productivity in Construction Claims